I wanted to look for methods how users can compare subjective “slowness” and benchmark their experience for others.
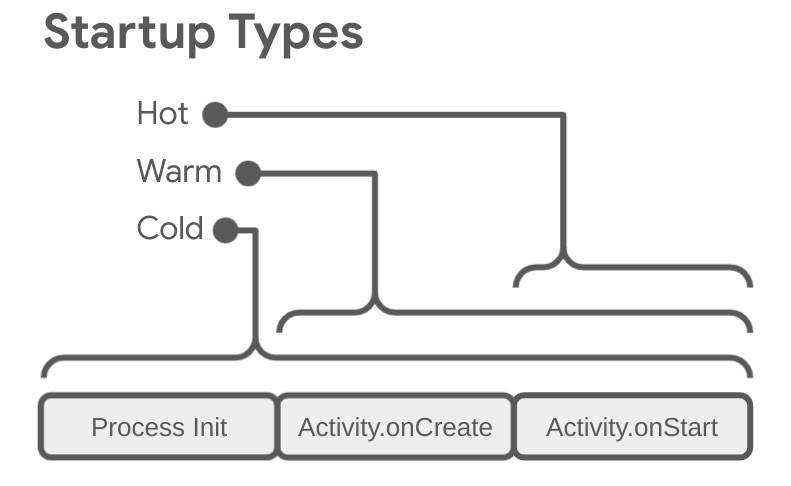
Android documentation has some acronyms for performance “vitals”, like “time to initial display” (TTID) for App startup, “time to full display” (TTFD) interaction time and “jank” for visible lag when rendering as in scrolling, see these two links:
I created a list from the apps (and resolved the main activitiy where necessary) present on the default install launcher screen of /e/ upper left to bottom right. You can either grep logcat for the “Displayed” string to get timings, or provide activitymanager (am) with the -W flag to get it in the loop. Get the appid via adb shell pm list packages or by checking logcat while starting it via touch.
adb shell am start -W <appid/app-main-activity>
Script
The script puts screen lock time to a few minutes for the time of the test. It’s best to run it after a reboot for a baseline to compare to. If the Android Runtime / jvm already has lots of Apps running in the background and not yet evicted timings can differ.
#!/usr/bin/env bash

echo "# set screen power and screen lock times to 10 minutes #"
adb shell settings put secure lock_screen_lock_after_timeout 600000
adb shell settings put global screen_off_timeout 600000

activities='foundation.e.apps/foundation.e.apps.MainActivity
foundation.e.tasks/org.dmfs.tasks.TaskListActivity
com.android.documentsui/.files.FilesActivity
foundation.e.mail
com.android.settings
com.android.gallery3d
foundation.e.calendar
com.android.contacts
com.generalmagic.magicearth/com.generalmagic.android.map.MapActivity
org.lineageos.eleven
foundation.e.notes/.android.activity.NotesListViewActivity
com.android.calculator2/.Calculator
org.lineageos.recorder
com.android.deskclock
com.android.dialer
foundation.e.message/com.moez.QKSMS.feature.main.MainActivity
foundation.e.browser
foundation.e.camera'

for activity in $activities
do
  echo "# $activity #"
  adb shell am start -W "$activity" | tee -a benchmark.log
  sleep 3
done

echo "# reset screen power and screen lock times #"
adb shell settings put secure lock_screen_lock_after_timeout 30000
adb shell settings put global screen_off_timeout 15000
If it is a complex app that needs the network to update, look for TotalTime, as it outputs the TTFD moment after the initial display that also can just be a loading symbol. The TTFD is when the network info for a UI listing is complete and a user can really start to interact. That is the TotalTime or in logcat “Fully drawn” for the main activity.
Android vitals considers your app’s startup times excessive when the app’s:
some example output. I’m aware that totalTime can be deceptive for apps that go into a loading screen. On paper those are fully-drawn activities, but not from a user-interaction perspective. The default Apps of /e/ are not suspectible to this but the Maps app.
Having JSON output that could be drag+dropped to a bit of locally working javascript would be helpful, but then, for commercial apps on would need to measure the activity that allows for final user-interaction.
This script is really nice.
I tried it with my FP3 and my startup times are always worse than yours, but still way faster than the “excessive” values from above. However, the screen timeout setting somehow failed silently and the screen locked while it was running. I simply used the “caffeine” feature of Android to keep it on.
It would be really nice if one could develop this into an app. Then we could have objective measurements whenever we get in the “my phone got slow after the recent update” situation.
when building aosp, some of the buildlogs (build.trace.gz and ninja.log) can be loaded into perfetto - a trace viewer. Not useful for hourlong traces - but to profile short app startup and runtime behaviour it is helpful.
It really couldn’t be easier to create a trace, you can use Chromes WebUSB ability and adb to create it from the UI, or first enable a quick-tile that can be later easily tapped (developer-options → system trace → enable quick-tile) and